Extremes Events of Tropical Island Thunderstorms
Does a Resolution Increase Improve their Representaion?
Martin Bergemann Uni Melbourne
1.0 Introduction
Convective storms in coastal areas of the tropics are of extraordinary importance for the earth climate system by distributing heat and moisture in the tropical atmosphere (CITE). The geography of the Maritime Continent with more than X islands, plays pivotal role in driving the tropical Walker Circulation. In a recent study bla et al. showed that island thunderstorms, often influenced by meso-scale land-sea interactions, release more heat into the atmosphere than any other tropical region.
In [ ]:
Simulation of Hector Events (12/11 - 20/11/2006)
In [5]:
import folium
borders = (([-17.091, -7.443] , [122.963, 139.055]),
           ([-14.505, -10.005], [127.385, 134.693]),
           ([-13.757, -10.757], [129.557, 132.529]))
coordinates = []
for n, (lats, lons) in enumerate(borders):
    x, y =[lons[0], lons[0], lons[1],lons[1]], [lats[0], lats[1], lats[1], lats[0]]
    l = list(zip(x,y))
    l.append(l[0])
    coordinates.append(l)
geoJsonData = {
    "features": [
        {
            "geometry": {
                "coordinates": coordinates[0]
                ,
                "type": "LineString"
            },
            "properties": {
                "stroke": "#fc1717",
                "stroke-opacity": 1,
                "stroke-width": 2
            },
            "type": "Feature"
        },
        {
            "geometry": {
                "coordinates": coordinates[1]
                ,
                "type": "LineString"
            },
            "properties": {
                "stroke": "#1f1a95",
                "stroke-opacity": 1,
                "stroke-width": 2
            },
            "type": "Feature"
        },
         {
            "geometry": {
                "coordinates": coordinates[2]
                ,
                "type": "LineString"
            },
            "properties": {
                "stroke": "orange",
                "stroke-opacity": 1,
                "stroke-width": 2
            },
            "type": "Feature"
        }

    ],
    "type": "FeatureCollection"
}
loc=(131.043101, -12.250323)[::-1]
m = folium.Map(location=loc, zoom_start=6)
folium.Marker(loc, popup=None, tooltip='CPOL', icon=None).add_to(m)
#folium.GeoJson(geoJsonData,
#    style_function=lambda x: {
#        'color' : x['properties']['stroke'],
#        'weight' : x['properties']['stroke-width'],
#        'opacity': 0.6,
#        }).add_to(m)
display(m)
- Model Setup
In [6]:
m = folium.Map(location=loc, zoom_start=6)
folium.Marker(loc, popup=None, tooltip='CPOL', icon=None).add_to(m)
folium.GeoJson(geoJsonData,
    style_function=lambda x: {
        'color' : x['properties']['stroke'],
        'weight' : x['properties']['stroke-width'],
        'opacity': 0.6,
        }).add_to(m)
display(m)
In [7]:
%%HTML
<ul>
<li>
<p><font color="#fc1717">4 km</font> → <font color='#1f1a95'>1.33 km</font>→ <font color='orange'> 0.44 km</font>
</li>
<li>80 Vertical Level</li>
<li>8 Ensemble Member, each 6 hours different init time</li>
</p>
</ul>
-
4 km → 1.33 km→ 0.44 km
- 80 Vertical Level
- 8 Ensemble Member, each 6 hours different init time
In [9]:
display(p3plot)
In [25]:
%%HTML
<figure>
<video width="750" height="400" loop="true" controls>
  <source src='WeekOfHector-Ens-3.mp4' type="video/mp4">
</video>
 <figcaption  style="text-align: right">Example UM 0.44km Simulation and CPOL</figcaption>
</figure>
The simulated Diurnal Cycle
In [26]:
%%HTML
<figure>
<video width="750" height="400" loop="true" controls>
  <source src='WeekOfHector-Diurnal-2.mp4' type="video/mp4">
</video>
 <figcaption  style="text-align: right">Diurnal Cycle</figcaption>
</figure>
How well are Extremes Represented?
In Summary:
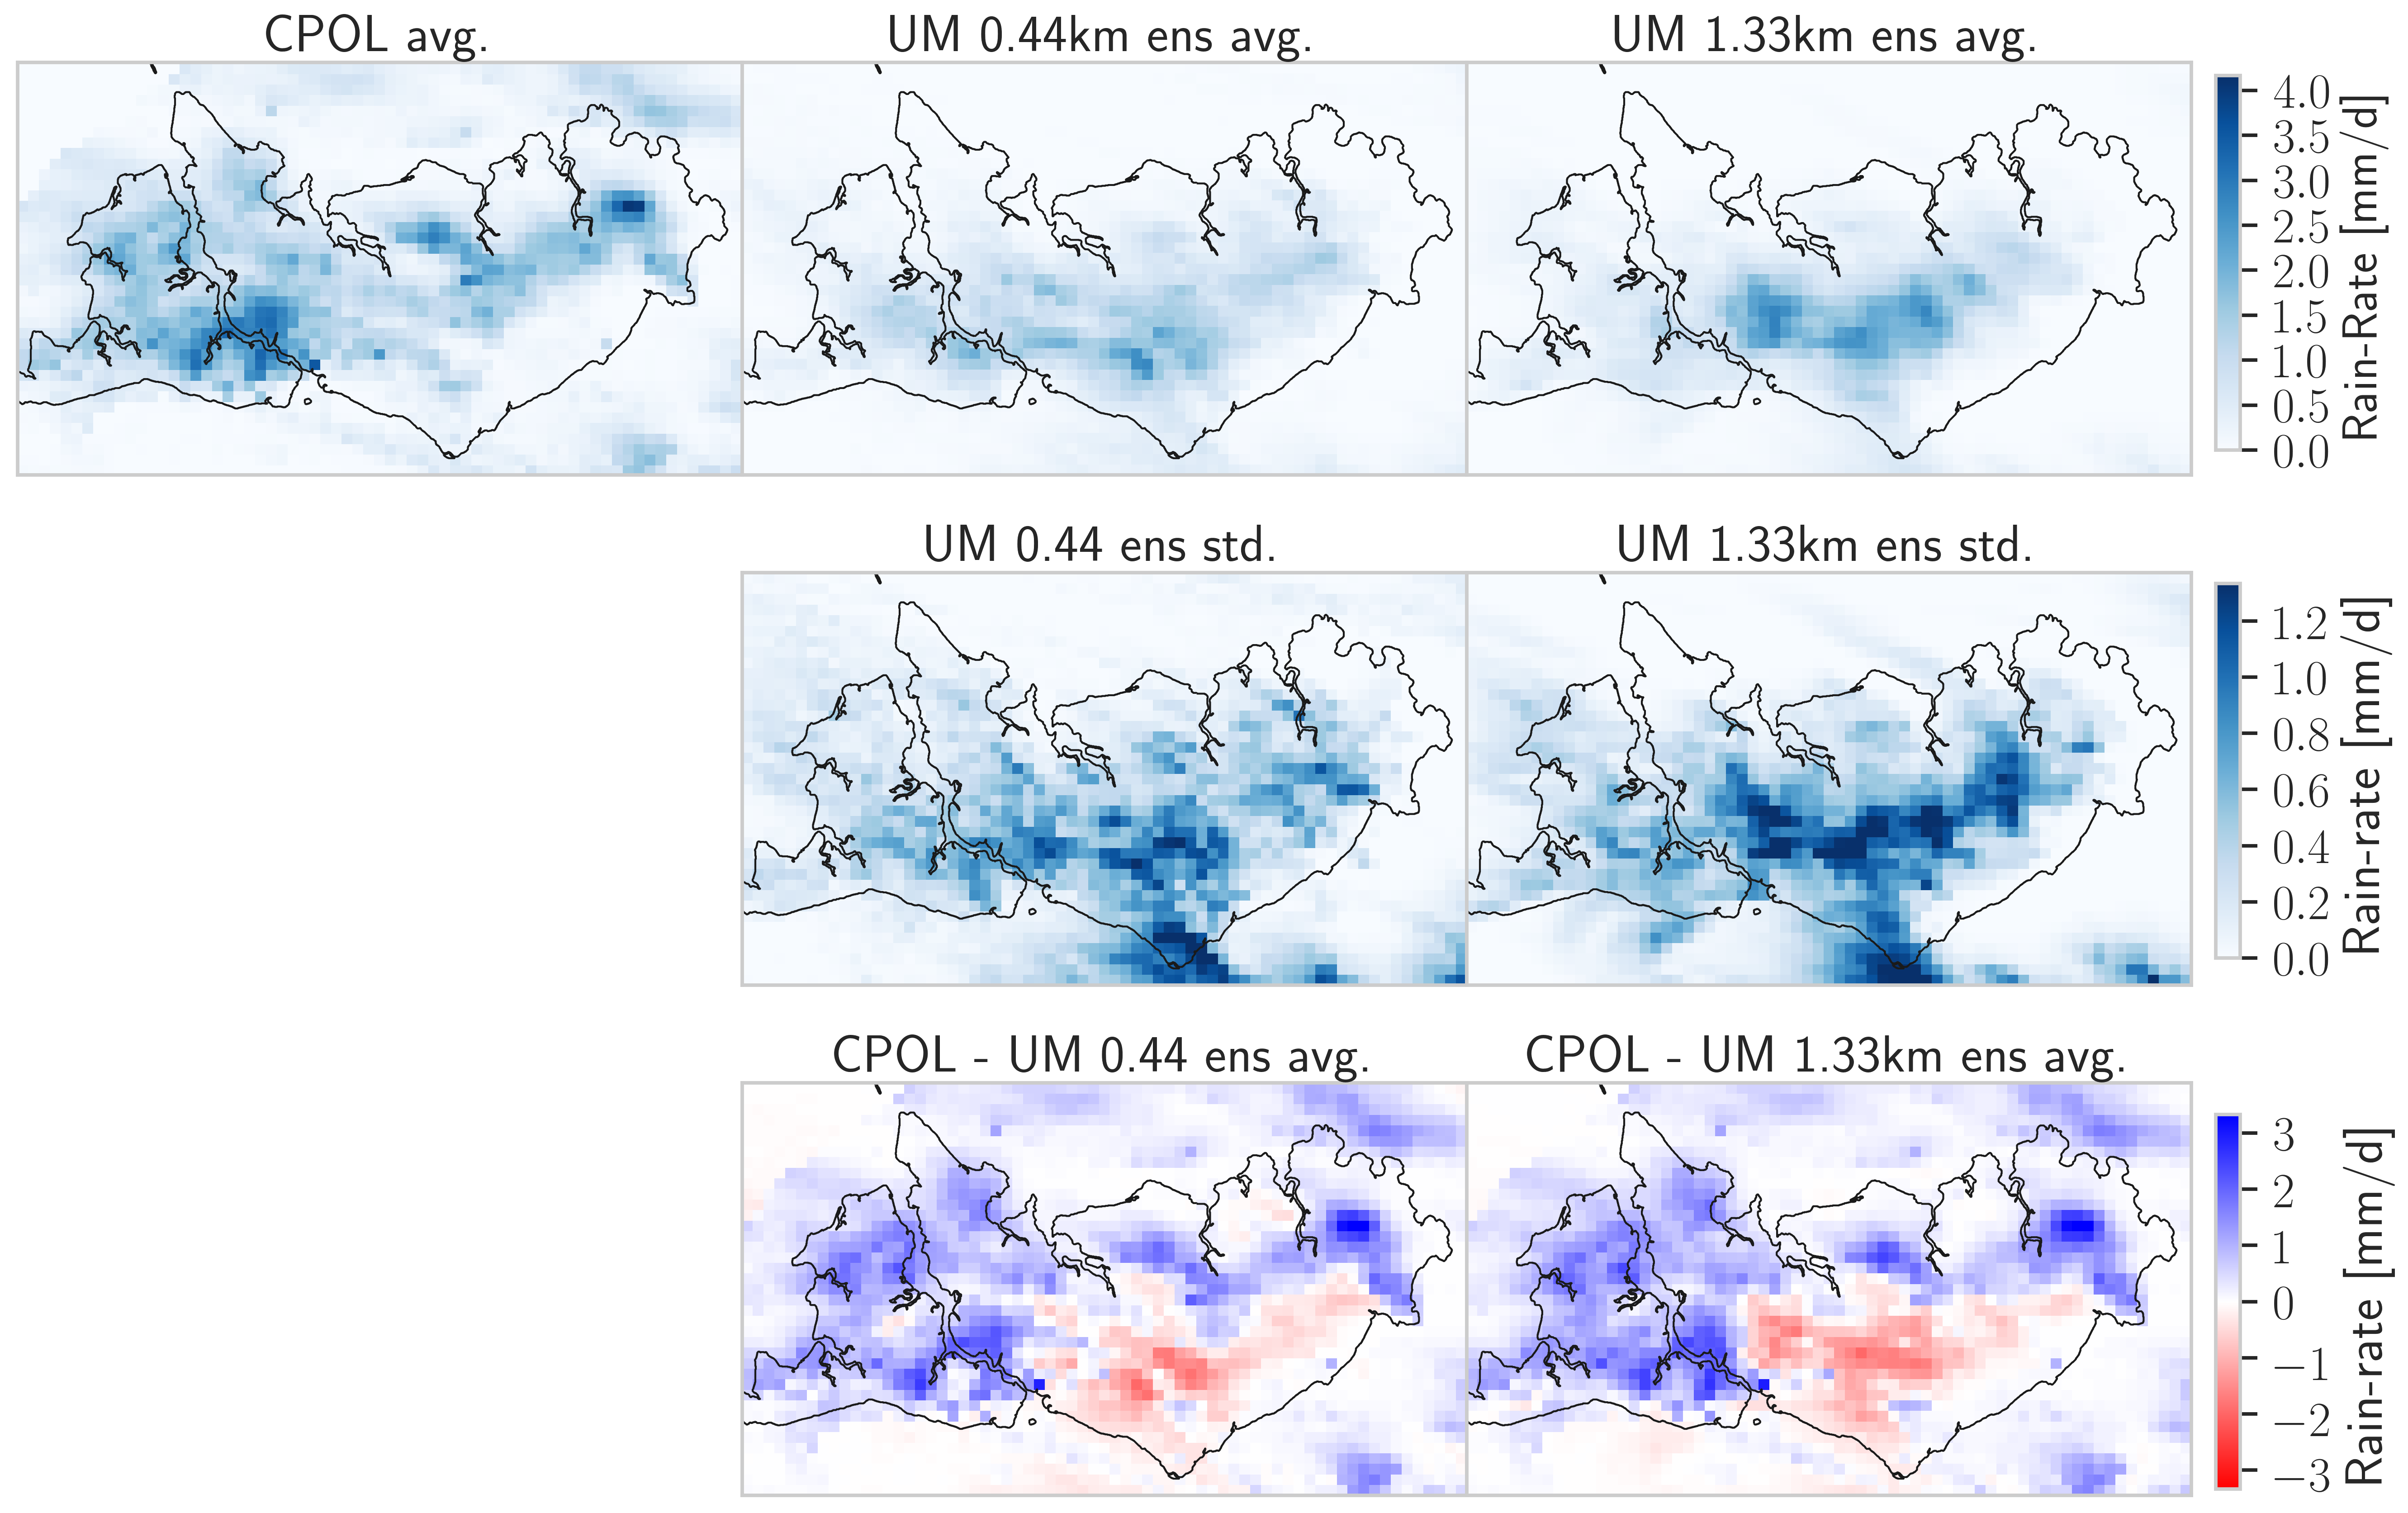
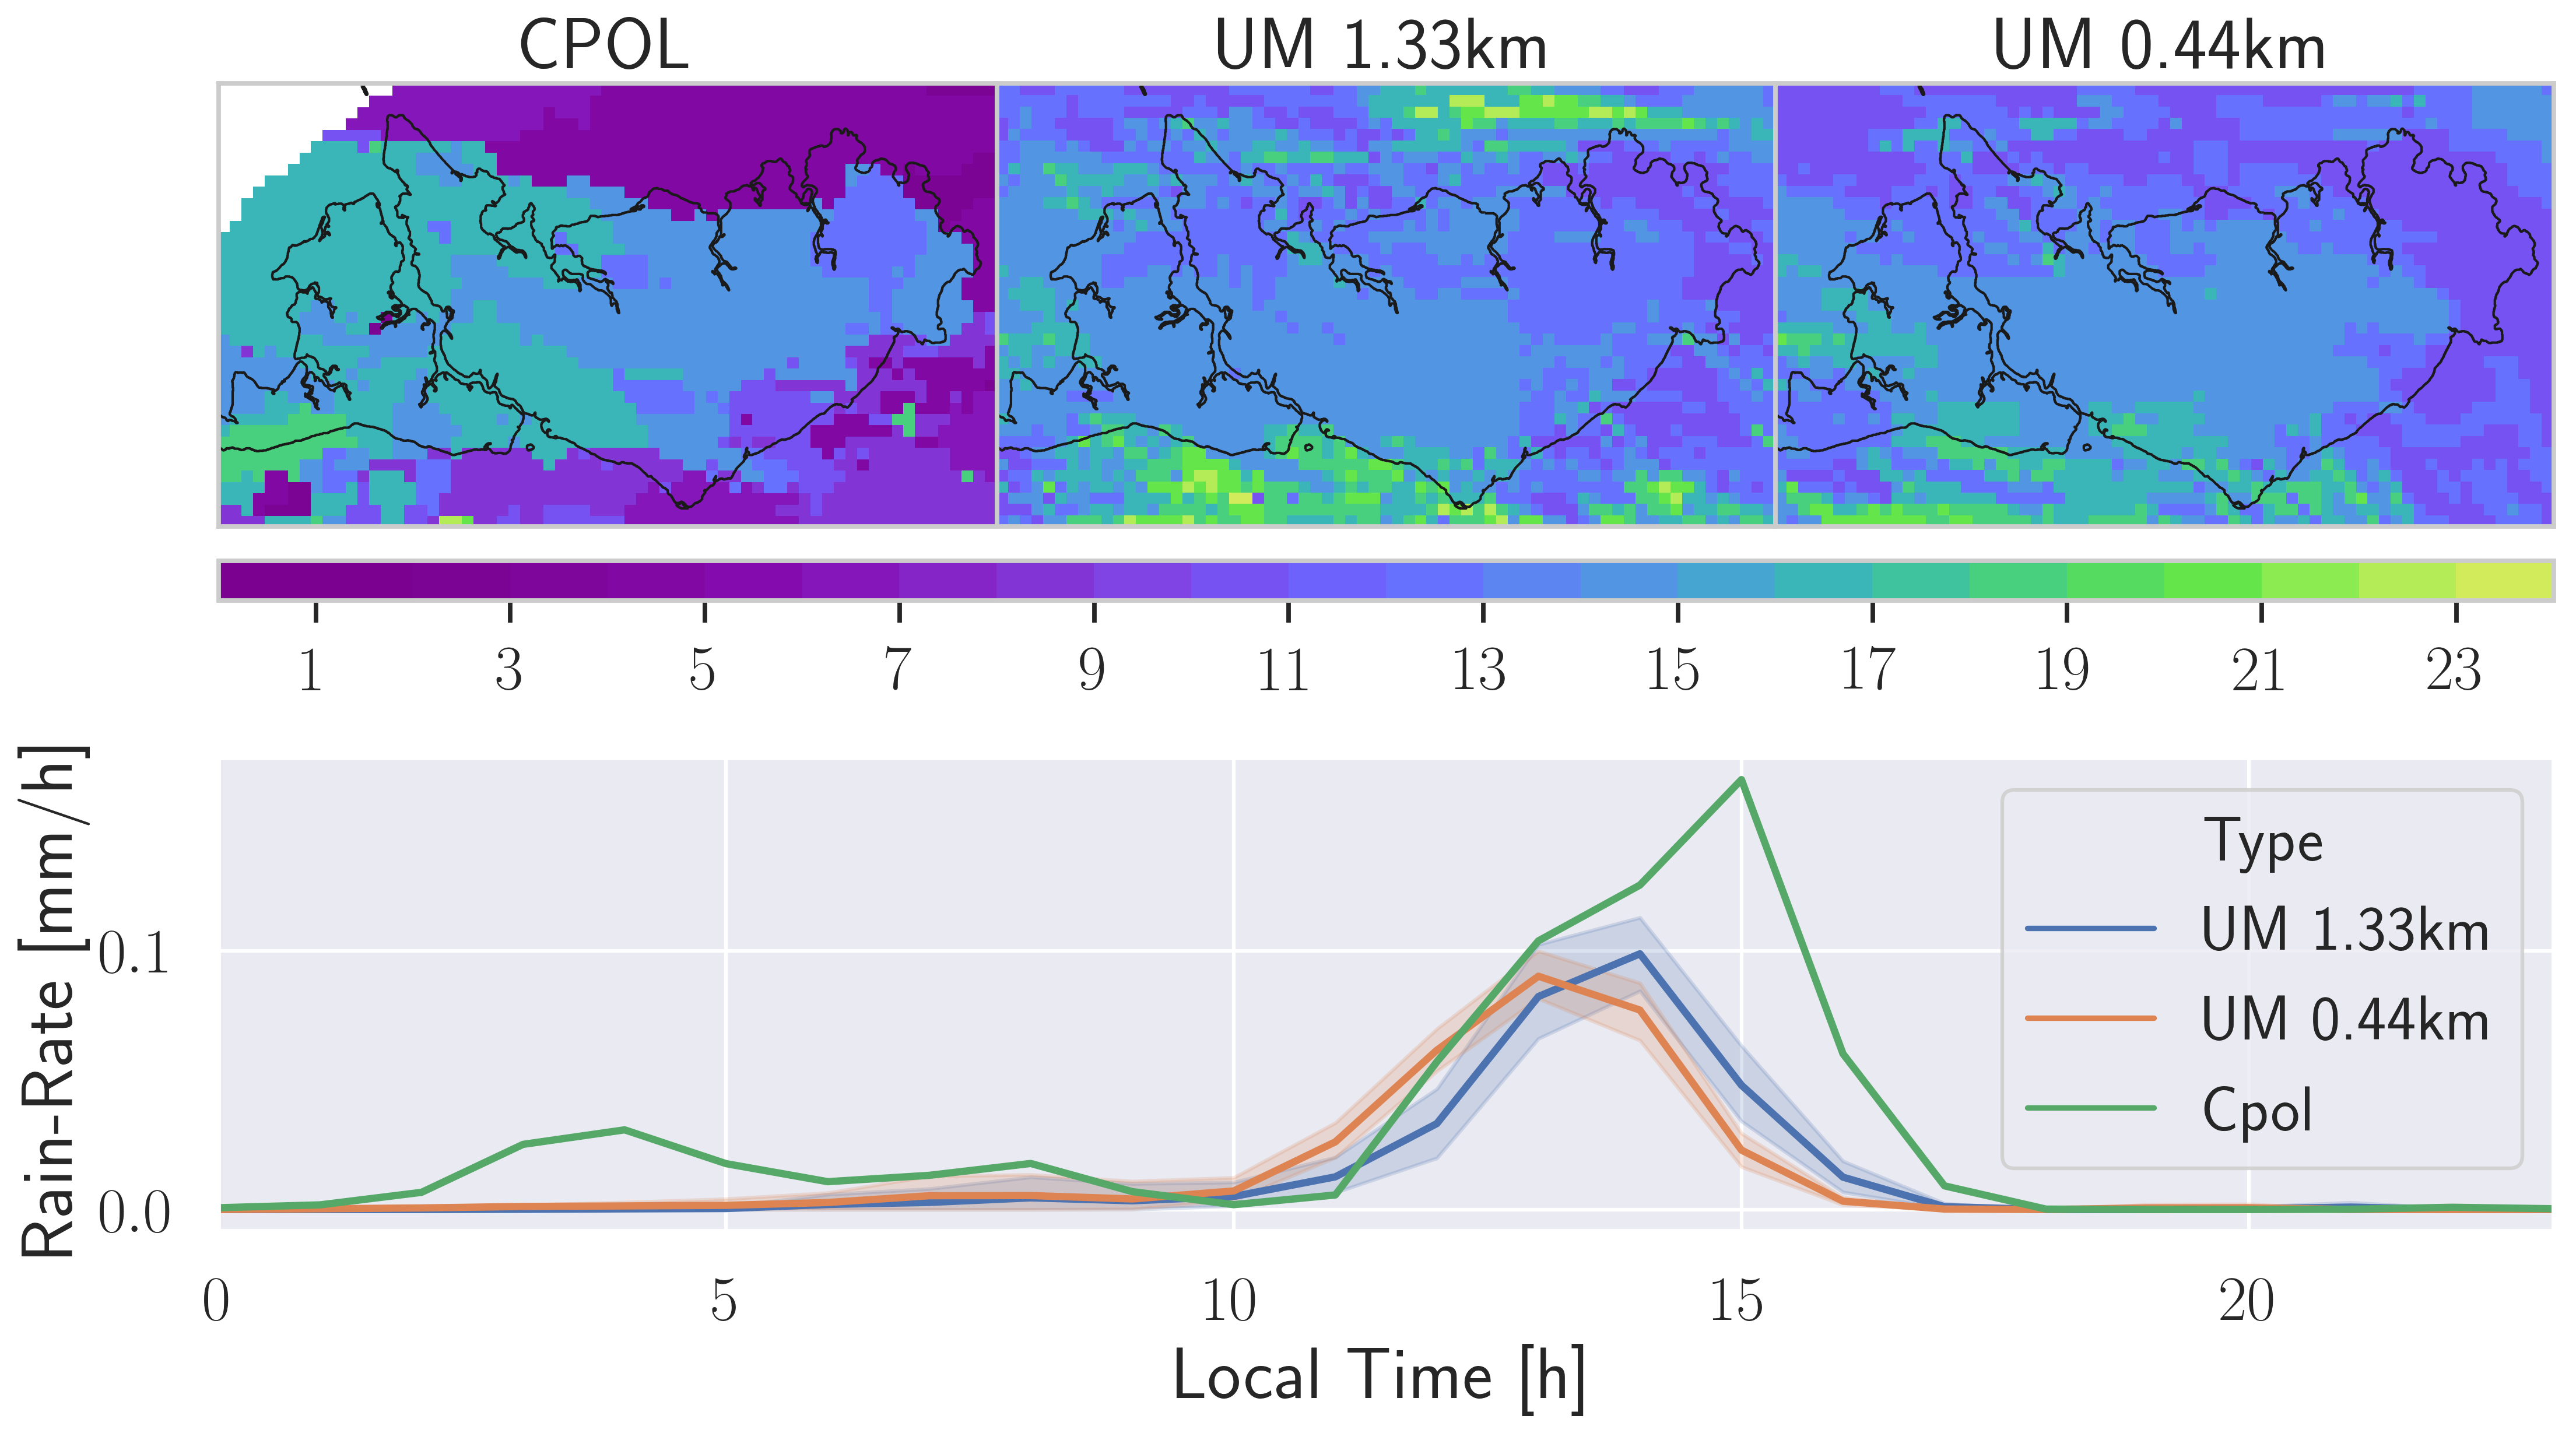
- Storms are a Little too early in the Model
- Occure too Central over Melville Island
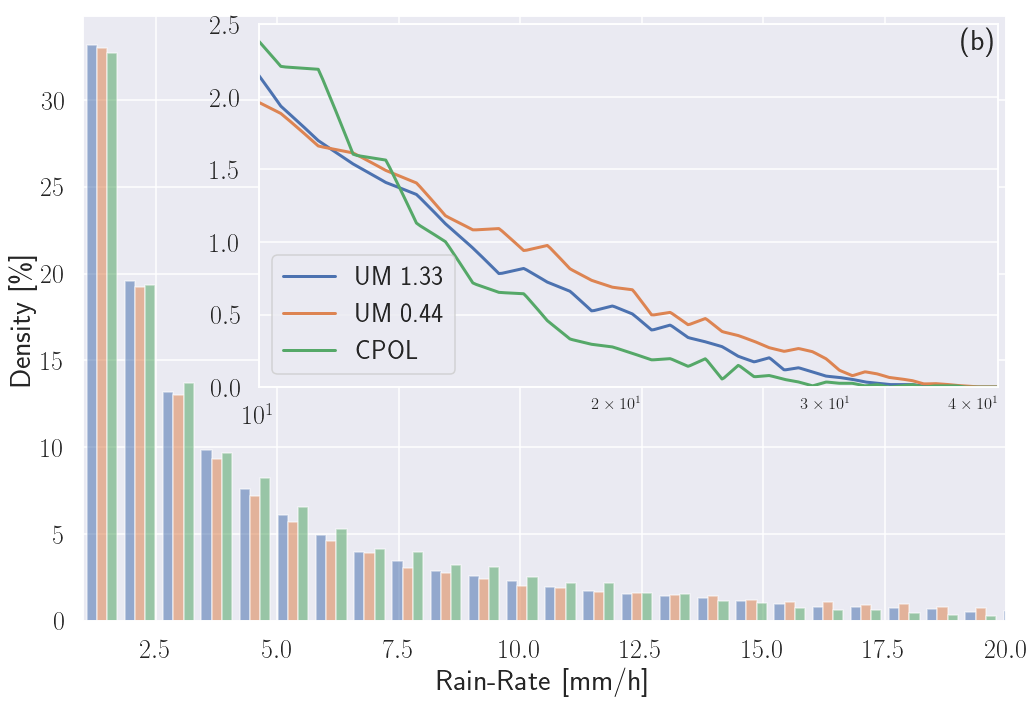
- Extreme Events are Slighly Over Estimated
- Slight Improvement with Higher Resolution Version
Storm-Track Analysis
- Analyse Strom tracks using an adopted tracking verion of TINT (TINT is not TITAN)
- TINT -> Tracking with Phase-Correlation and "Hungarian" similarity mathiching
In [15]:
display(pd.read_pickle('medians.pkl').round(2))
| UM 1.33km | UM 0.44km | CPOL | |
|---|---|---|---|
| Area | 76.67 | 61.25 | 110.68 |
| Duration | 60.00 | 50.00 | 60.00 |
| Avg-Rain | 4.78 | 5.65 | 4.52 |
| Max-Rain | 6.90 | 8.56 | 6.79 |
| Speed | 10.03 | 12.71 | 12.67 |
| # Storms | 73.00 | 50.00 | 42.00 |
Storm Intensities
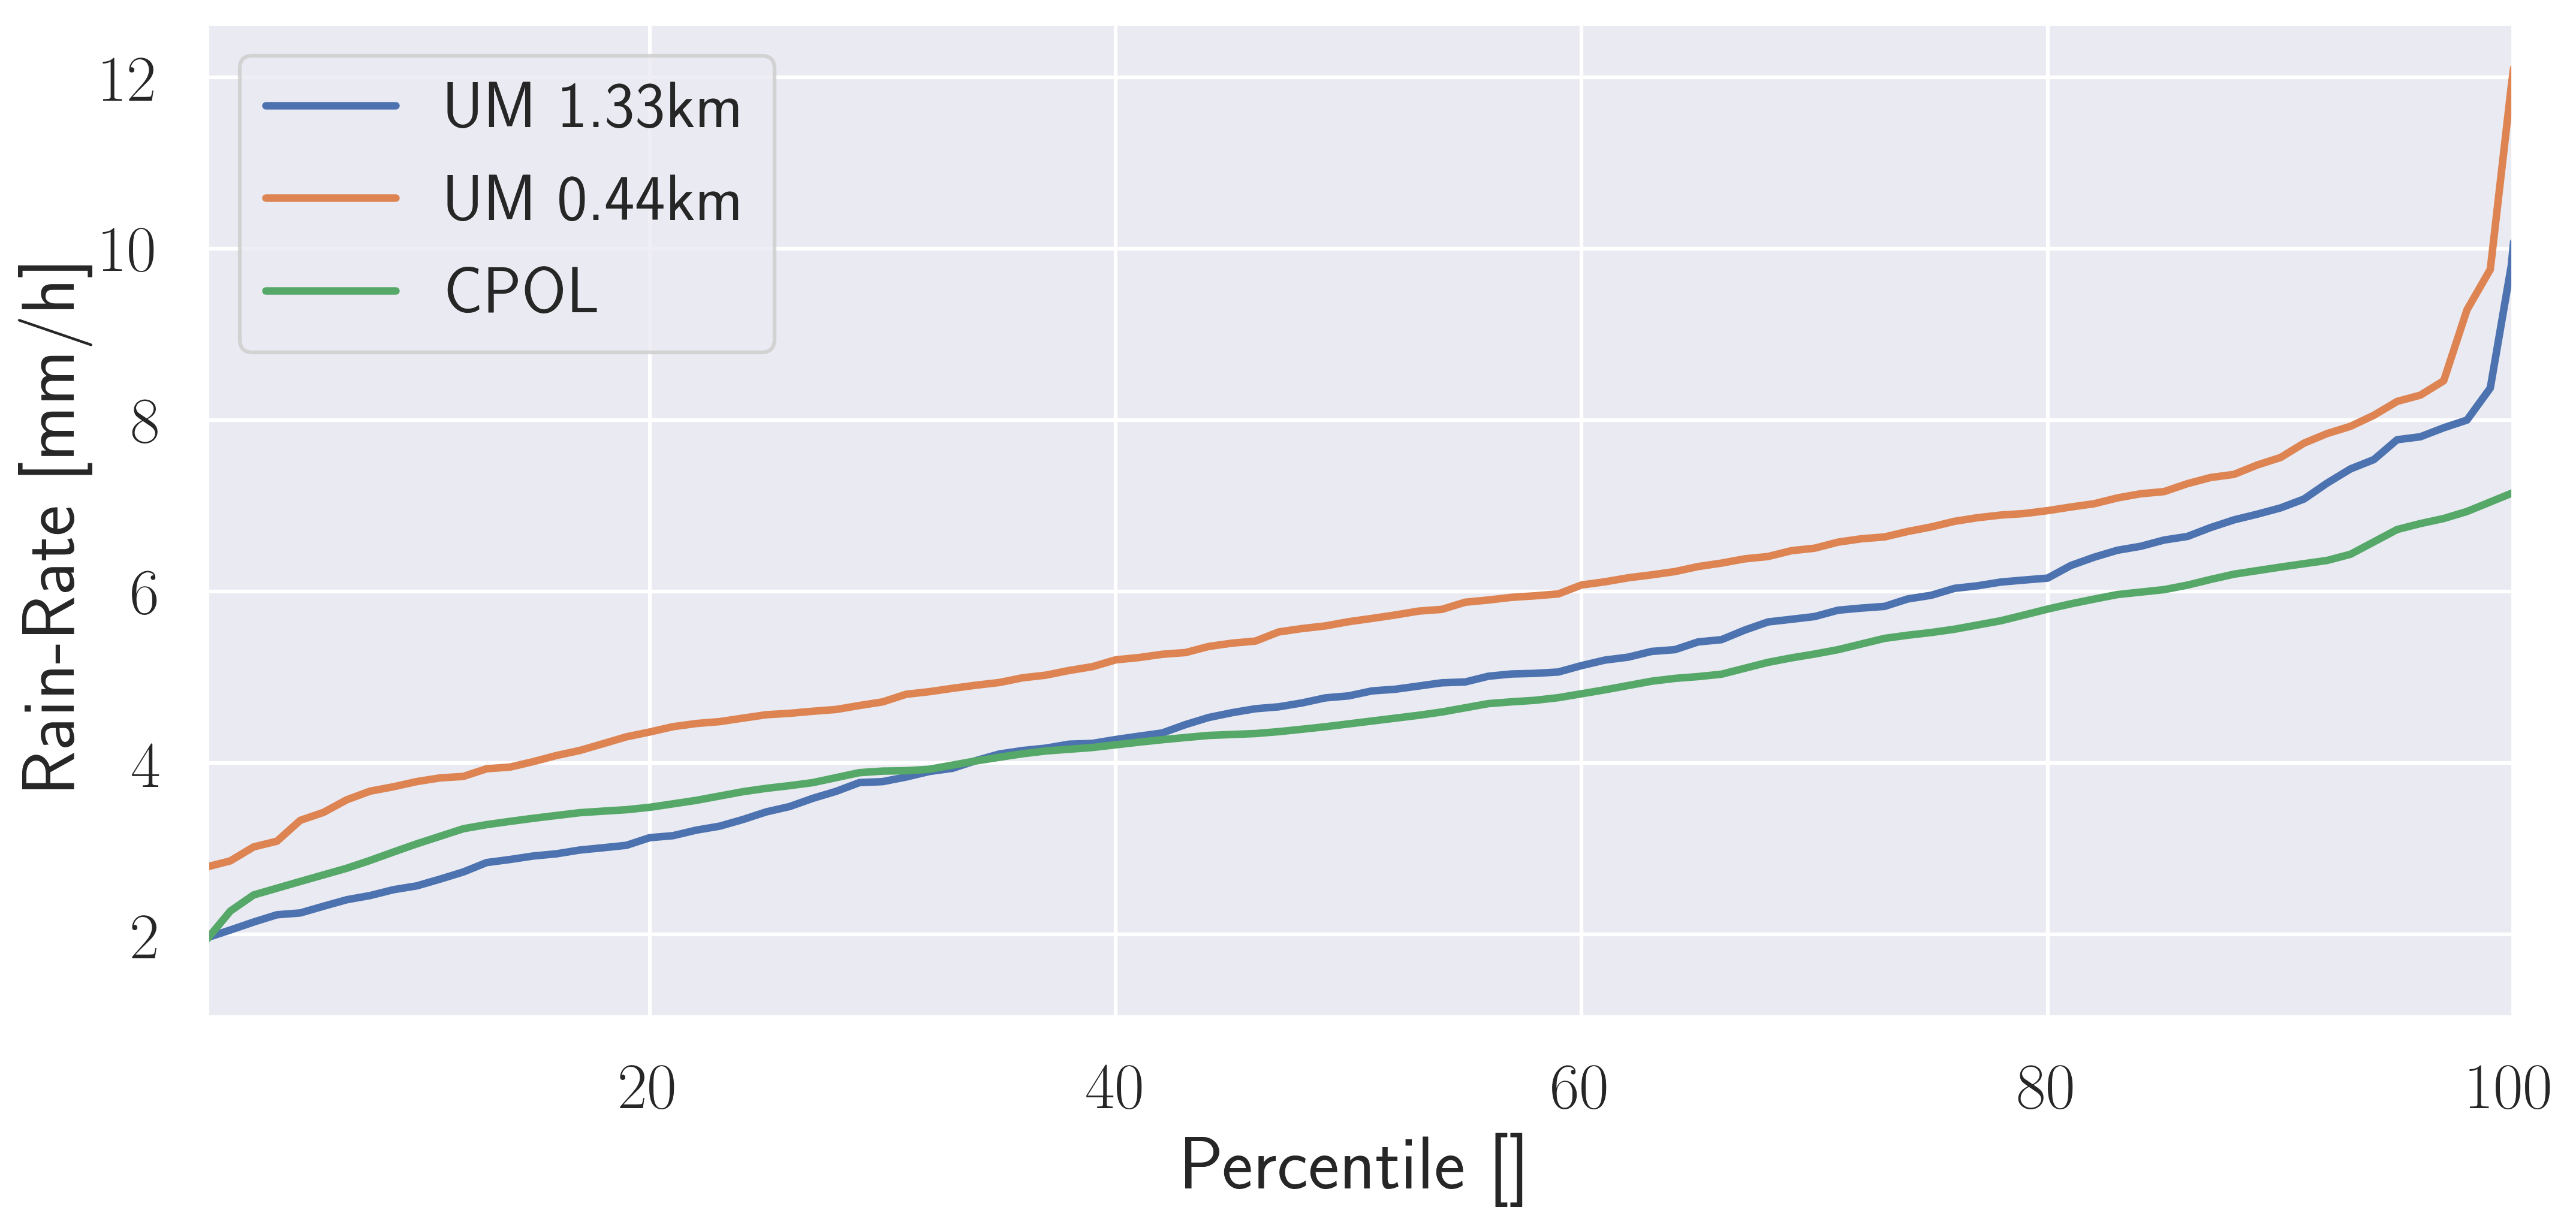
The strongest Stormes (>9th decile)
In [12]:
f =  open('../slides/d3plot_map.dmp','rb')
mapplot = pickle.load(f)
f.close()
display(mapplot)
Storm Properties by Intensity
In [15]:
data1, data2 = [], []
obs = ('UM 1.33km', 'UM 0.44km', 'CPOL')
colors = ('#1f77b4', '#ff7f0e', 'green')
for ii in range(3):
    df = cycles.loc[cycles.type == obs[ii]].sort_values('time')
    #domain = [ii*1/3, ii*1/3+.3]
    for i in range(0,6):
        if i == 0:
            tmp = df
            visible = True
        else:
            tmp = df.loc[df.quant == i]
            visible = False
        tmp = tmp.groupby('time').mean()
        y1 = tmp['rr']
        y2 = tmp['dur']
        x1 = tmp.index
        trace = go.Scatter(
            x = x1,
            y = y1,
            name=obs[ii],
            xaxis='x',
            yaxis='y',
            mode = 'markers',
            visible = visible
        )
        data1.append(trace)
        trace = go.Scatter(
            x = x1,
            y = y2,
            name=obs[ii],
            xaxis='x',
            yaxis='y2',
            mode = 'lines',
            showlegend = False,
            line = dict(color = colors[ii], width = 2),
            visible = visible
        )
        data2.append(trace)


y_axis_layout=dict( gridcolor='rgb(255,255,255)', showgrid=True, showline=False, showticklabels=True,
           tickcolor='rgb(127,127,127)', ticks='outside', zeroline=False, title='Rain-Rate [mm/h]',
                   range=[2,10])
y_axis_layout2=dict( gridcolor='rgb(255,255,255)', showgrid=True, showline=False, showticklabels=True,
           tickcolor='rgb(127,127,127)', ticks='outside', zeroline=False, title='Duration [min]',
                   range=[0,140], overlaying='y', side='right')
x_axis_layout=dict( gridcolor='rgb(255,255,255)', showgrid=True, showline=False, showticklabels=True,
           tickcolor='rgb(127,127,127)', ticks='outside', zeroline=False, title='Life-Cycle [%]')

layout = go.Layout(
    width=700,
    height=600,
    autosize=False,
    paper_bgcolor='rgb(255,255,255)',
    plot_bgcolor='rgb(229,229,229)',
    xaxis=x_axis_layout,
    yaxis=y_axis_layout,
    yaxis2=y_axis_layout2,
    legend=dict(orientation="h"),
    font=dict(family='serif', size=18, color='#7f7f7f')
)

steps=[]
labels={i: str(i) for i in range(1,6)}
labels[0] = 'All'
for n in range(6):
    step = dict(
        method = 'restyle',
        args = ['visible', [False] * (len(data1)+len(data2))],
        label=labels[n])
    for ii in range(3):
        step['args'][1][n+ii*6] = True # Toggle i'th trace to "visible"
        step['args'][1][(n+ii*6)+len(data1)] = True # Toggle i'th trace to "visible"
    steps.append(step)

sliders = [dict(
    active = 0,
    currentvalue = {"prefix": "Quintile: "},
    pad = {"t": 75},
    steps = steps,
    font = dict(size=16)

)]
layout['sliders'] = sliders

fig = go.Figure(data=data1+data2, layout=layout)
display(py.iplot(fig, show_link=False))
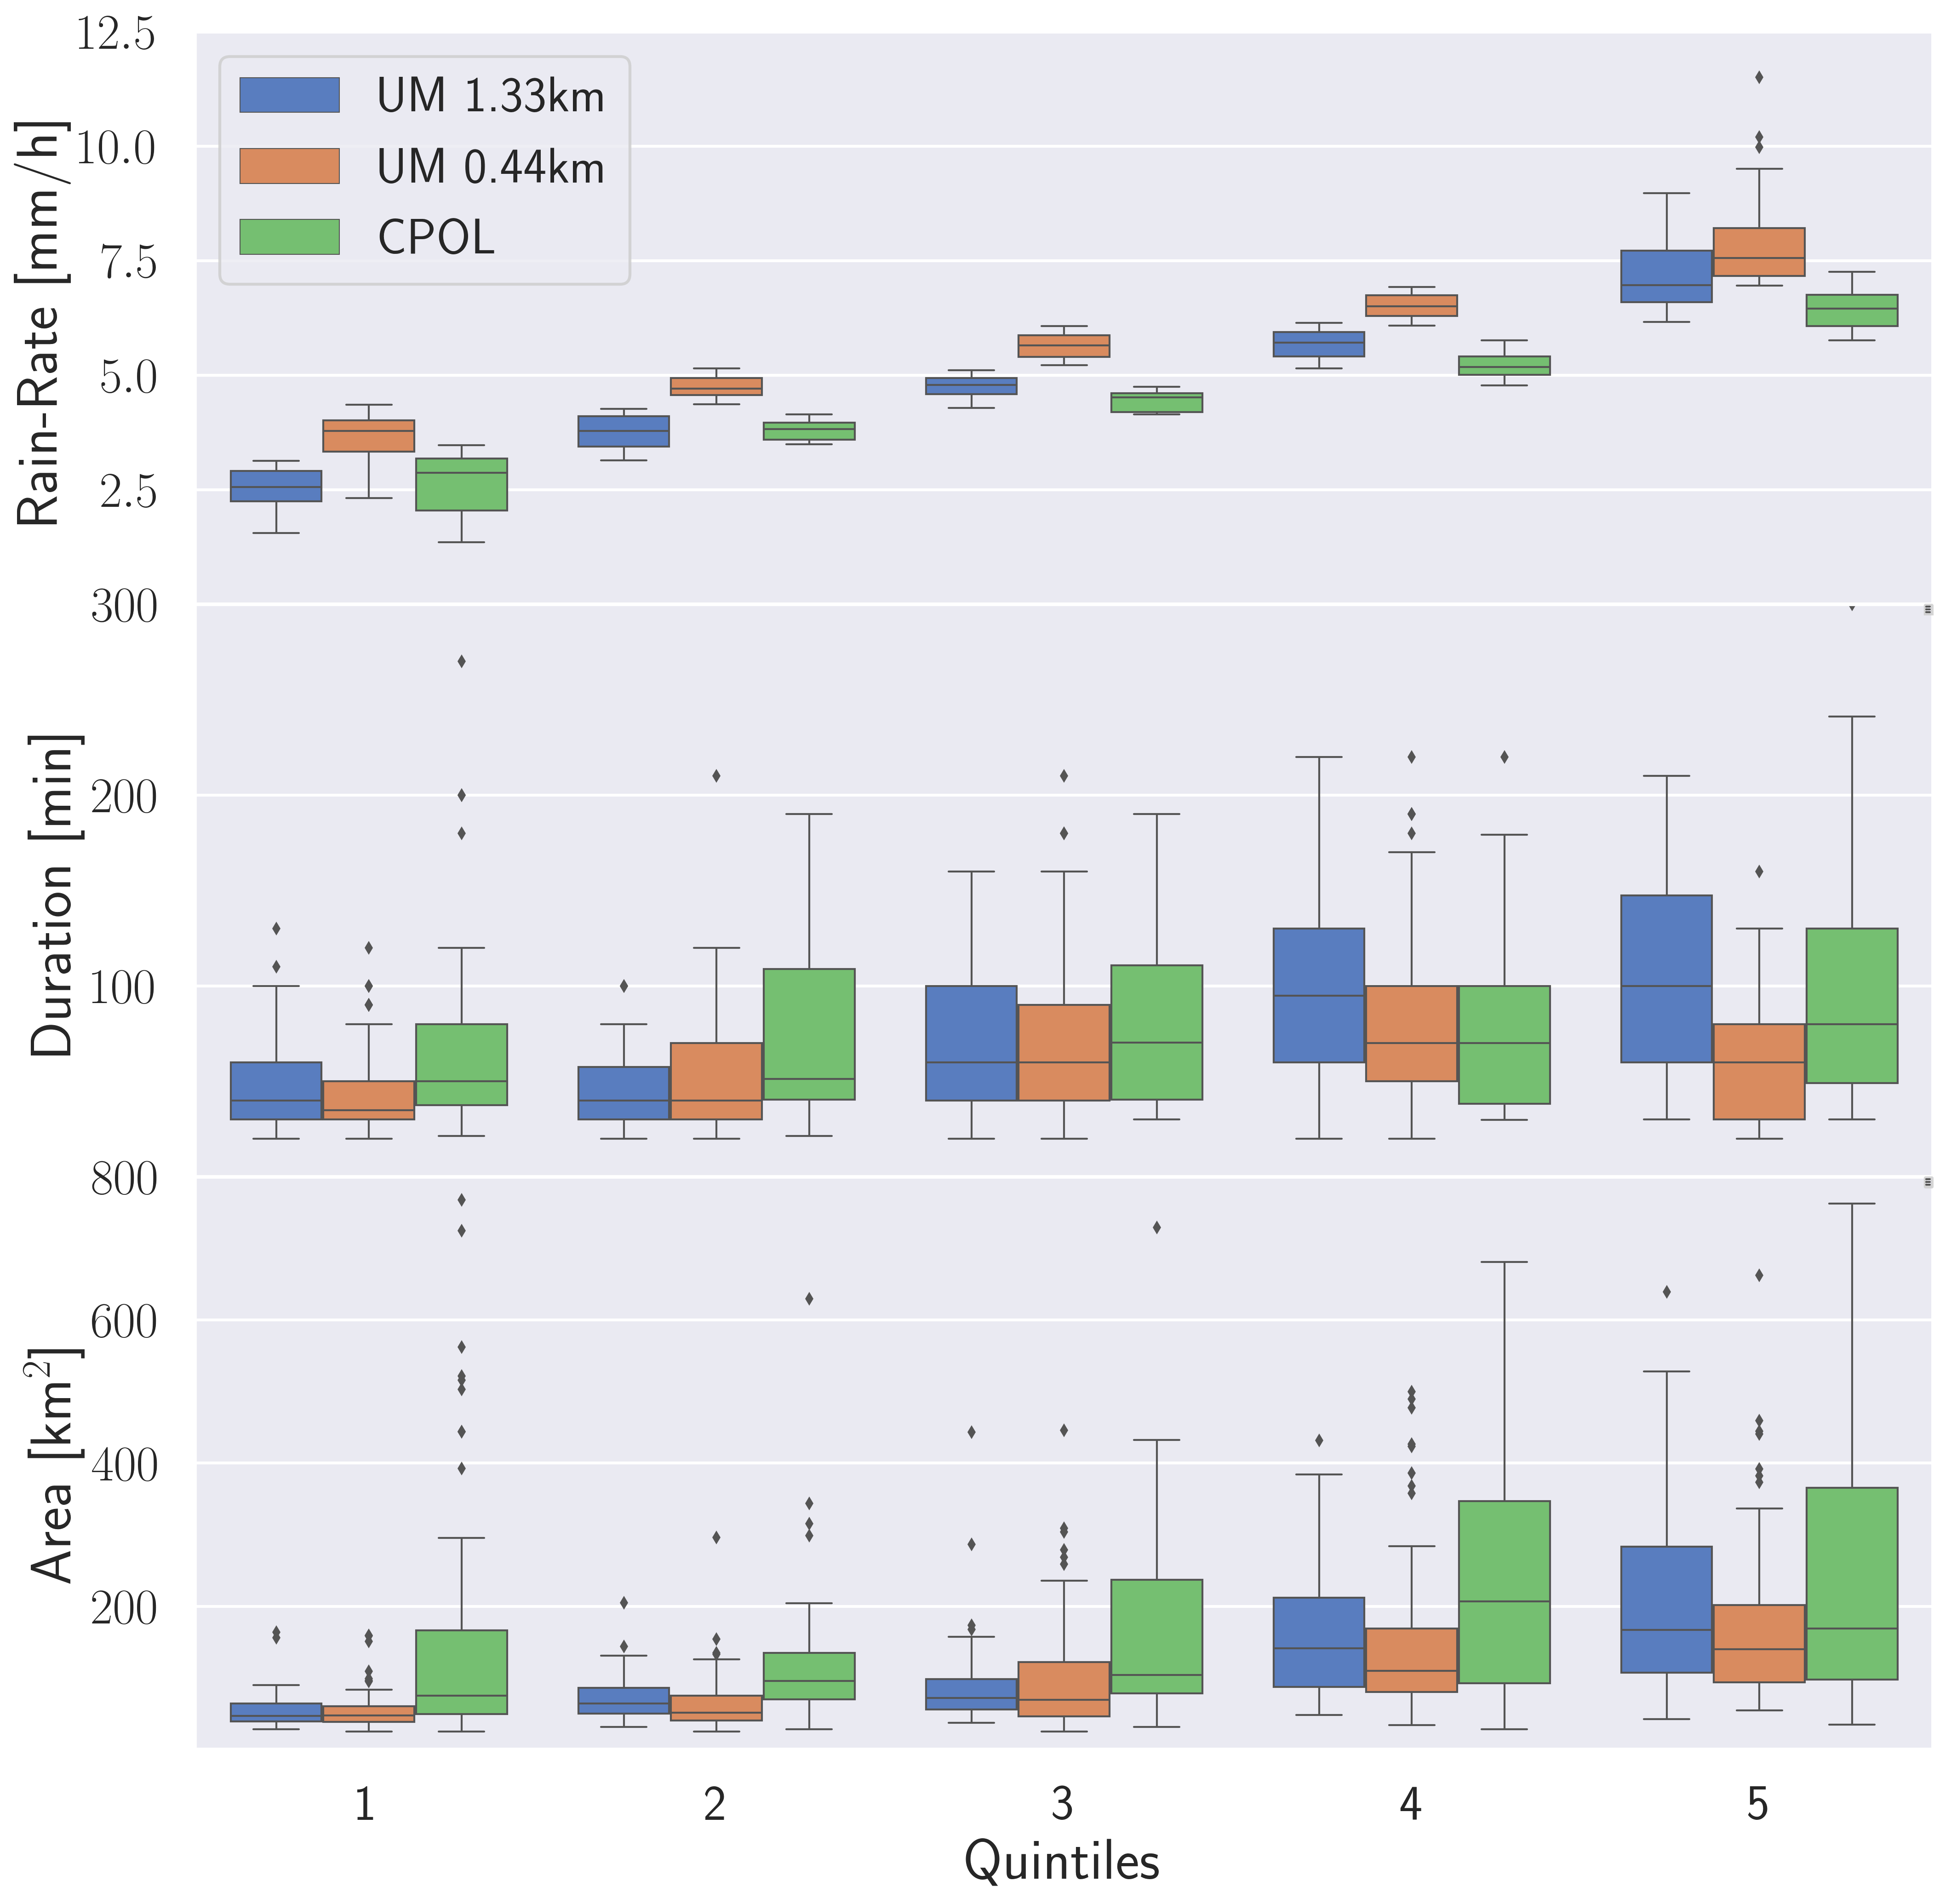
Why are Storms more intense in the Sub-km version?
- Investigation of Cold-Pools
In [16]:
%%HTML
<figure>
<video width="500" loop="true" controls>
  <source src='/home/unimelb.edu.au/mbergemann/Work/notebooks/Work/Programming/Extremes/slides/ColdPool-Ens-1.mp4' type="video/mp4">
</video>
 <figcaption  style="text-align: right">Tracking with Density Potential Temperature Field Pertubation</figcaption>
</figure>

- The State of the Atmosphere
In [19]:
from copy import deepcopy

variables=dict(omega=(("$\\overline{\\omega'}$ [m/s]"), (-9.5e-2, 8.5e-1), 1),
               mflux=("$\\overline{\\omega' q'}$ [m g/kg s]", (-1.2e-1, 1.6), 1000))#
nrow = 0
data = []
fontsize = 18
y_axis_layout=dict( gridcolor='rgb(255,255,255)', showgrid=True, showline=False, showticklabels=True,
                    titlefont=dict(size=fontsize), tickcolor='rgb(127,127,127)', ticks='outside',
                    zeroline=False, range=[P[0], P[-1]])
x_axis_layout=dict( gridcolor='rgb(255,255,255)', showgrid=True, showline=False, showticklabels=True,
                    tickcolor='rgb(127,127,127)', ticks='outside', zeroline=False, titlefont=dict(size=fontsize))
for layout_dict in (x_axis_layout, y_axis_layout):
    layout_dict['tickfont']=dict(size=fontsize-2)
    layout_dict['automargin'] = True

xaxis = {}
yaxis = {}
nplot = 1
nquint = 5
hspace, vspace = 0.01, 0.15
titles = []
colors = ('#1f77b4', '#ff7f0e')
for nvar, (var, prop) in enumerate(variables.items()):
    nrow += 1
    varn, xrange, mul = prop
    for nn, quint in enumerate(range(1,nquint+1)):
        for nrun, (run, flx) in enumerate(fluxes.items()):
            x = flx[var][quint] * mul
            if nrow == 1 :
                yname = 'y'
            else:
                yname = 'y%i'%(nrow*nquint-nquint+1)
            if nplot > 1:
                showlegend=False
            else:
                showlegend=True
            trace = go.Scatter(
                x = x,
                y = P,
                name=run,
                xaxis='x%i'%(nplot),
                yaxis= yname,
                visible = True,
                showlegend = showlegend,
                mode = 'lines',
                line = dict(color = colors[nrun], width = 3)
            )
            data.append(trace)
        yaxis['yaxis%i'%(nplot)] = deepcopy(y_axis_layout)
        xaxis['xaxis%i'%(nplot)] = deepcopy(x_axis_layout)
        xaxis['xaxis%i'%(nplot)]['title'] = varn
        yaxis['yaxis%i'%(nplot)]['domain'] = split(len(variables), vspace)[nrow-1]
        xaxis['xaxis%i'%(nplot)]['domain'] = split(nquint, hspace)[nn]
        xaxis['xaxis%i'%(nplot)]['anchor'] = yname
        yaxis['yaxis%i'%(nplot)]['anchor'] = 'x%i'%nplot
        xaxis['xaxis%i'%(nplot)]['range'] = xrange
        if quint == 1:
            yaxis['yaxis%i'%(nplot)]['title']='Pressure [hPa]'
        if nrow == 1:
            xaxis['xaxis%i'%(nplot)]['range'] = xrange
            sp = split(nquint, hspace)[nn]
            titles.append(dict(x=(xrange[1]-xrange[0])/2 - ((xrange[1]-xrange[0])/20),
                               y=split(nquint, vspace)[-1][-1]+vspace/4,
                               showarrow=False,
                               text='Quintile %i'%quint,
                               xref='x%i'%(nplot),
                               yref='paper'))
        nplot += 1

layout = go.Layout(
    width=750,
    height=800,
    annotations=titles,
    autosize=False,
    paper_bgcolor='rgb(255,255,255)',
    plot_bgcolor='rgb(229,229,229)',
    font=dict(family='serif', size=fontsize, color='#7f7f7f')
)
for axis, axlayout in yaxis.items():
    layout[axis] = axlayout
for axis, axlayout in xaxis.items():
    layout[axis] = axlayout

'''
steps=[]
labels={i: str(i) for i in range(1,6)}
labels[0] = 'All'
for n in range(6):
    step = dict(
        method = 'restyle',
        args = ['visible', [False] * len(data)],
        label=labels[n])
    for ii in range(2):
        step['args'][1][n+ii*6] = True # Toggle i'th trace to "visible"
    steps.append(step)

sliders = [dict(
    active = 5,
    currentvalue = {"prefix": "Quintile: "},
    pad = {"t": 75},
    steps = steps,
    font=dict(size=16)
)]
layout['sliders'] = sliders
'''
fig = go.Figure(data=data, layout=layout)
display(py.iplot(fig, show_link=False))
- The State of the Atmosphere
In [20]:
from copy import deepcopy
from collections import OrderedDict


variables=dict(mse_pre=("$\overline{s_{v_{l}}'}/c_{p_{d}}$ [K]", (-1.4, 2), 1),
               cloud_pl_rain=("$\overline{q_l'}$ [g/kg]", (-0.02, 0.3), 1))#
nrow = 0
data = OrderedDict()
fontsize = 18
y_axis_layout=dict( gridcolor='rgb(255,255,255)', showgrid=True, showline=False, showticklabels=True,
                    titlefont=dict(size=12), tickcolor='rgb(127,127,127)', ticks='outside',
                    zeroline=False, range=[P[0], P[-1]])
x_axis_layout=dict( gridcolor='rgb(255,255,255)', showgrid=True, showline=False, showticklabels=True,
                    tickcolor='rgb(127,127,127)', ticks='outside', zeroline=False,
                    titlefont=dict(size=fontsize-2))
for layout_dict in (x_axis_layout, y_axis_layout):
    layout_dict['tickfont']=dict(size=fontsize-2)
    layout_dict['automargin'] = True

xaxis = {}
yaxis = {}
nplot = 1
nquint = 5
hspace, vspace = 0.02, 0.15
titles = []
colors = ('#1f77b4', '#ff7f0e')
for nvar, (var, prop) in enumerate(variables.items()):
    nrow += 1
    varn, xrange, mul = prop
    for nn, quint in enumerate(range(1,nquint+1)):
        for nrun, (run, flx) in enumerate(fluxes.items()):
            x = flx[var][quint] * mul
            if nrow == 1 :
                yname = 'y'
            else:
                yname = 'y%i'%(nrow*nquint-nquint+1)
            if nplot > 1:
                showlegend=False
                name = 'during'
            else:
                showlegend=True
                name = run
            trace = go.Scatter(
                x = x,
                y = P,
                name=name,
                xaxis='x%i'%(nplot),
                yaxis= yname,
                visible = True,
                showlegend = showlegend,
                mode = 'lines',
                line = dict(color = colors[nrun], width = 3)
            )
            data['%s_%s_%s'%(var, quint, run)] = trace
        yaxis['yaxis%i'%(nplot)] = deepcopy(y_axis_layout)
        xaxis['xaxis%i'%(nplot)] = deepcopy(x_axis_layout)
        xaxis['xaxis%i'%(nplot)]['title'] = varn
        yaxis['yaxis%i'%(nplot)]['domain'] = split(len(variables), vspace)[nrow-1]
        xaxis['xaxis%i'%(nplot)]['domain'] = split(nquint, hspace)[nn]
        xaxis['xaxis%i'%(nplot)]['anchor'] = yname
        yaxis['yaxis%i'%(nplot)]['anchor'] = 'x%i'%nplot
        xaxis['xaxis%i'%(nplot)]['range'] = xrange
        if quint == 1:
            yaxis['yaxis%i'%(nplot)]['title']='Pressure [hPa]'
        if nrow == 1:
            xaxis['xaxis%i'%(nplot)]['range'] = xrange
            sp = split(nquint, hspace)[nn]
            titles.append(dict(x=(abs(xrange[1]-xrange[0]))/2 - (abs(xrange[1]-xrange[0]))/3,
                               y=split(nquint, vspace)[-1][-1]+vspace/4,
                               showarrow=False,
                               text='Quintile %i'%quint,
                               xref='x%i'%(nplot),
                               yref='paper'))
        nplot += 1

for quint in range(1, nquint+1):
    for run in ('UM 1.33km', 'UM 0.44km'):
        x = fluxes[run]['cloud_pl_pre'][quint]
        key1 = 'cloud_pl_rain_%i_%s'%(quint, run)
        key2 = 'cloud_pl_pre_%i_%s'%(quint, run)
        new_data = deepcopy(data[key1])
        new_data['visible']=False
        new_data['x'] = x
        new_data['name'] = 'before'
        new_data['showlegend'] = False
        data[key2] = new_data

for quint in range(1, nquint+1):
    for run in ('UM 1.33km', 'UM 0.44km'):
        x = fluxes[run]['cloud_pl_pre'][quint]
        key1 = 'cloud_pl_rain_%i_%s'%(quint, run)
        key2 = 'cloud_pl_prep_%i_%s'%(quint, run)
        new_data = deepcopy(data[key1])
        new_data['line']['dash'] = 'dash'
        new_data['visible']=False
        new_data['x'] = x
        new_data['name'] = 'before'
        new_data['showlegend'] = False
        data[key2] = new_data


layout = go.Layout(
    width=750,
    height=800,
    annotations=titles,
    autosize=False,
    paper_bgcolor='rgb(255,255,255)',
    plot_bgcolor='rgb(229,229,229)',
    font=dict(family='serif', size=fontsize, color='#7f7f7f')
)
for axis, axlayout in yaxis.items():
    layout[axis] = axlayout
for axis, axlayout in xaxis.items():
    layout[axis] = axlayout
steps=[]
Labels = ('Druing', 'Before', 'Before+During')
for n in range(3):
    step = dict(
        method = 'restyle',
        args = ['visible', [True] * len(data)],# 'showlegend', [False] * len(data)],
        label=Labels[n])
    step['args'][-1][:2]=[True, True]
    if n == 1:
        step['args'][1][10:20] = 10*[False] # Toggle i'th trace to "visible"
        #step['args'][1][-10:] = 10*[False] # Toggle i'th trace to "visible"
    elif n == 0:
        step['args'][1][-20:] = 20*[False] # Toggle i'th trace to "visible"
    elif n == 2:
        step['args'][1][-20:-10] = 10*[False] # Toggle i'th trace to "visible"
        #step['args'][-1][3] = [True]
        #step['args'][-1][-1] = [True]

    steps.append(step)

sliders = [dict(
    active = 0,
    currentvalue = {"prefix": "State: "},
    pad = {"t": 50},
    steps = steps,
    font=dict(size=fontsize)
)]
layout['sliders'] = sliders

fig = go.Figure(data=list(data.values()), layout=layout)
display(py.iplot(fig, show_link=False))
- Also somthing in the Boundary Layer
In [22]:
from scipy.stats import norm
from scipy.stats import gaussian_kde
from sklearn.neighbors import KernelDensity
data = []
var = 'ustar'
Min, Max = 0, 1
X_plot = np.linspace(Min, Max, 1000)
obs = ('UM 1.33km', 'UM 0.44km')
for ii in range(2):
    df = pbl_types.loc[pbl_types.run == obs[ii]]
    for i in range(0,6):
        if i == 0:
            tmp = df
        else:
            tmp = df.loc[df.quant == i]
        visible = False
        if i == 5:
            visible = True
        x = tmp[var].values[:]#.reshape(1,-1)
        #kde = KernelDensity(kernel='gaussian', bandwidth=0.75).fit(x)
        kde = gaussian_kde(x)
        log_dens = kde(X_plot)
        trace = go.Scatter(
            x = X_plot,
            y = log_dens,
            name=obs[ii],
            xaxis='x',
            yaxis='y',
            visible = visible,
            mode='lines',
            fill='tozeroy'
        )
        data.append(trace)


y_axis_layout=dict( gridcolor='rgb(255,255,255)', showgrid=True, showline=False, showticklabels=True,
                    tickcolor='rgb(127,127,127)', ticks='outside', zeroline=False, title='Density [%]',
                    range=[0, 3.7])
x_axis_layout=dict( gridcolor='rgb(255,255,255)', showgrid=True, showline=False, showticklabels=True,
                    tickcolor='rgb(127,127,127)', ticks='outside', zeroline=False, title='u* [m/s]')

layout = go.Layout(
    width=700,
    height=600,
    autosize=False,
    paper_bgcolor='rgb(255,255,255)',
    plot_bgcolor='rgb(229,229,229)',
    xaxis=x_axis_layout,
    yaxis=y_axis_layout,
    font=dict(family='serif', size=18, color='#7f7f7f')
)

steps=[]
labels={i: str(i) for i in range(1,6)}
labels[0] = 'All'
for n in range(6):
    step = dict(
        method = 'restyle',
        args = ['visible', [False] * len(data)],
        label=labels[n])
    for ii in range(2):
        step['args'][1][n+ii*6] = True # Toggle i'th trace to "visible"
    steps.append(step)

sliders = [dict(
    active = 5,
    currentvalue = {"prefix": "Quintile: "},
    pad = {"t": 75},
    steps = steps,
    font=dict(size=16)
)]
layout['sliders'] = sliders

fig = go.Figure(data=data, layout=layout)
display(py.iplot(fig, show_link=False))
In [24]:
%%HTML
<figure>
<video width="750" height="350" loop="true" controls>
  <source src='/home/unimelb.edu.au/mbergemann/Work/notebooks/Work/Programming/Extremes/slides/ColdPool_nativ_2.mp4' type="video/mp4">
</video>
 <figcaption  style="text-align: right">Cold-Pool (center) and Rainfall (outer) for two ensemble member</figcaption>
</figure>
<img src="/home/unimelb.edu.au/mbergemann/Work/notebooks/Work/Programming/Extremes/slides/Diagram1.png" alt="Study area" style="height:150px;"/>
<p>One possible problem: Micro-Phys. depends on RH<sub>crit</sub> that is chosen on 80!! levels</p>

One possible problem: Micro-Phys. depends on RHcrit that is chosen on 80!! levels
In [ ]: