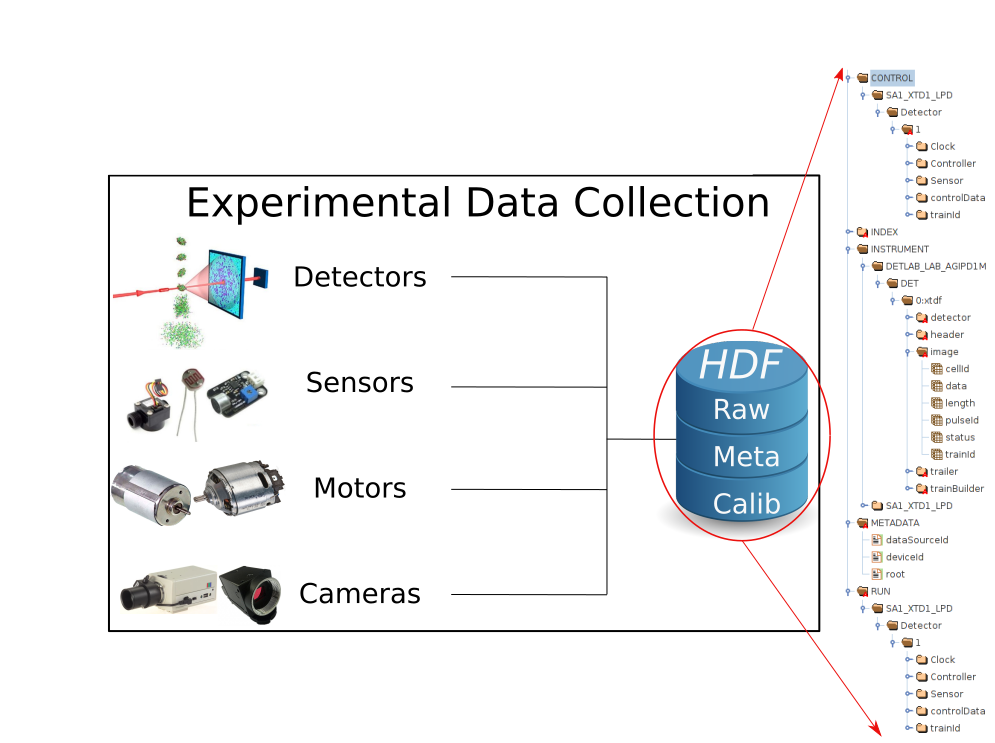

A Closer Look at Detector Data:
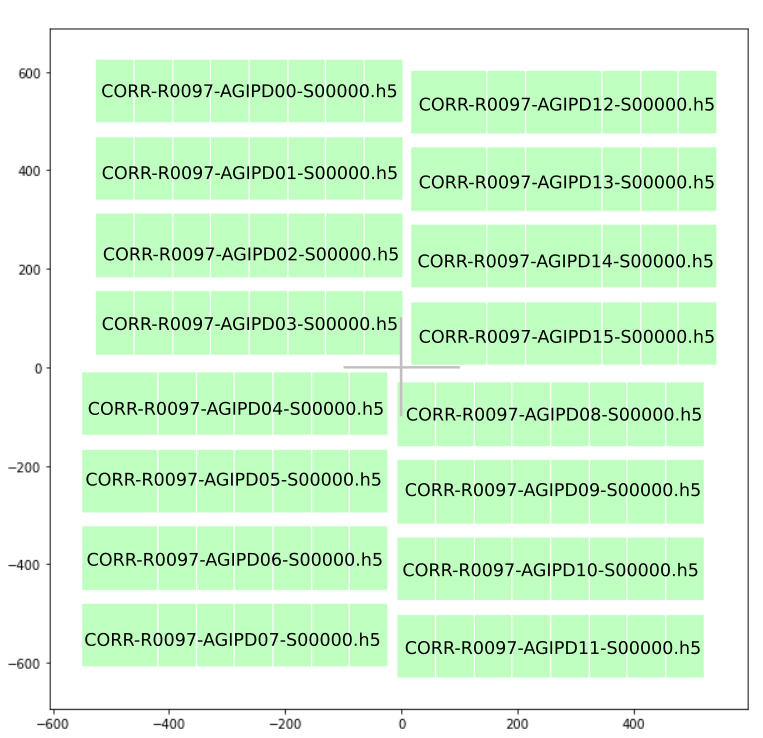
$: lsxfel /gpfs/exfel/exp/XMPL/201750/p700000/raw/r0273
r0273 : Run directory

# of trains:    156
Duration:       0:00:15.500000
First train ID: 198425241
Last train ID:  198425396

16 detector modules (SPB_DET_AGIPD1M-1)
  e.g. module SPB_DET_AGIPD1M-1 0 : 512 x 128 pixels
  176 frames per train, 27456 total frames

2 instrument sources (excluding detectors):
  - SA1_XTD2_XGM/XGM/DOOCS:output
  - SPB_XTD9_XGM/XGM/DOOCS:output

13 control sources:
  - ACC_SYS_DOOCS/CTRL/BEAMCONDITIONS
  - SA1_XTD2_XGM/XGM/DOOCS
  - SPB_IRU_AGIPD1M/PSC/HV
  - SPB_IRU_AGIPD1M/TSENS/H1_T_EXTHOUS
  - SPB_IRU_AGIPD1M/TSENS/H2_T_EXTHOUS
  - SPB_IRU_AGIPD1M/TSENS/Q1_T_BLOCK
  - SPB_IRU_AGIPD1M/TSENS/Q2_T_BLOCK
  - SPB_IRU_AGIPD1M/TSENS/Q3_T_BLOCK
  - SPB_IRU_AGIPD1M/TSENS/Q4_T_BLOCK
  - SPB_IRU_AGIPD1M1/CTRL/MC1
  - SPB_IRU_AGIPD1M1/CTRL/MC2
  - SPB_IRU_VAC/GAUGE/GAUGE_FR_6
  - SPB_XTD9_XGM/XGM/DOOCS
Using standard hdf5 tools can be tricky and tedious
karabo-data
- Python Library that supports Analysis of EuXFEL Data.
- It is Open Source and available on the maxwell cluster @ desy.
Aim of this presentation:
Give you a glimpse of what is possible and provide a ground base for your own data analysis at EuXFEL
Scenario I: Plot some detector data
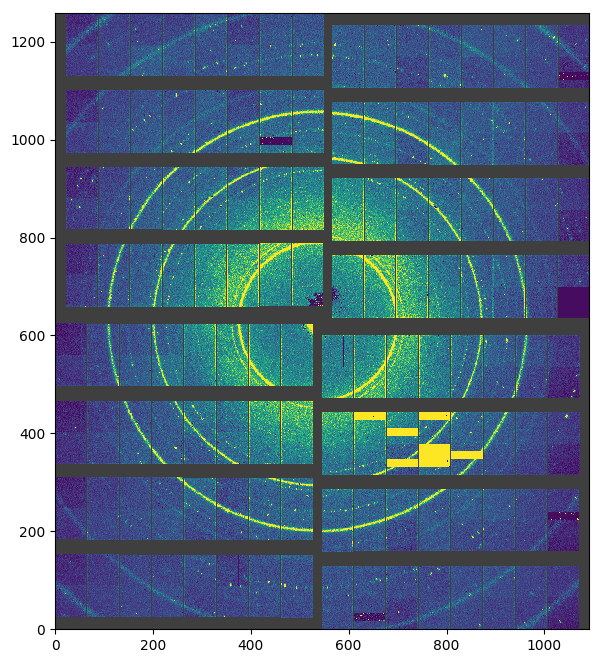
- How could this data be retrieved and visualized?
Reading a run directory:
One of the big advantages of karabo-data is that whole runs can be read with only one command:
Data can be accessed by:
- selecting trains by id's →
.train_from_id - selecting trains by indexes →
.train_from_index - iteration (looping) over trains →
.trains
Let's select data based on indexes:
Getting run information:
RunDirectory has a info method that displays a useful run experiment overview:
run_folder = '/gpfs/exfel/exp/XMPL/201750/p700000/raw/r0273'
run_dir = kd.RunDirectory(run_folder)
run_dir.info()
# of trains:    156
Duration:       0:00:15.500000
First train ID: 198425241
Last train ID:  198425396

16 detector modules (SPB_DET_AGIPD1M-1)
  e.g. module SPB_DET_AGIPD1M-1 0 : 512 x 128 pixels
  176 frames per train, 27456 total frames

2 instrument sources (excluding detectors):
  - SA1_XTD2_XGM/XGM/DOOCS:output
  - SPB_XTD9_XGM/XGM/DOOCS:output

13 control sources:
  - ACC_SYS_DOOCS/CTRL/BEAMCONDITIONS
  - SA1_XTD2_XGM/XGM/DOOCS
  - SPB_IRU_AGIPD1M/PSC/HV
  - SPB_IRU_AGIPD1M/TSENS/H1_T_EXTHOUS
  - SPB_IRU_AGIPD1M/TSENS/H2_T_EXTHOUS
  - SPB_IRU_AGIPD1M/TSENS/Q1_T_BLOCK
  - SPB_IRU_AGIPD1M/TSENS/Q2_T_BLOCK
  - SPB_IRU_AGIPD1M/TSENS/Q3_T_BLOCK
  - SPB_IRU_AGIPD1M/TSENS/Q4_T_BLOCK
  - SPB_IRU_AGIPD1M1/CTRL/MC1
  - SPB_IRU_AGIPD1M1/CTRL/MC2
  - SPB_IRU_VAC/GAUGE/GAUGE_FR_6
  - SPB_XTD9_XGM/XGM/DOOCS
Selecting data based by trains is simple with karabo-data but what if data should be selected across trains?
Scenario II: Extracting Data across trains with one value per train
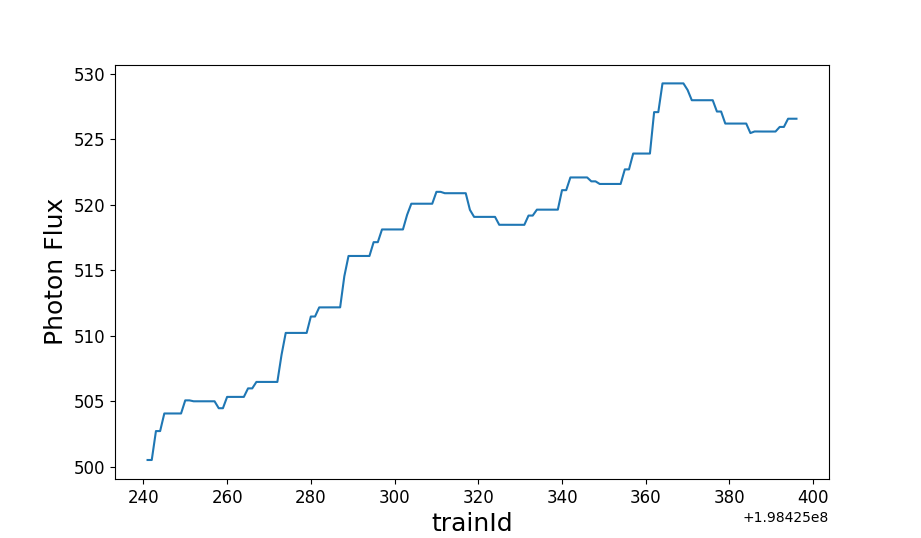
- How can 1D data be extracted and plotted?
The get_series method can extract a series across trainID's for a given device and property:
ph_flux = run_dir.get_series('SA1_XTD2_XGM/XGM/DOOCS', 'pulseEnergy.photonFlux.value')
type(ph_flux)
pandas.core.series.Series
ph_flux.head(5)
trainId
198425241    500.519470
198425242    500.519470
198425243    502.727203
198425244    502.727203
198425245    504.070953
Name: SA1_XTD2_XGM/XGM/DOOCS/pulseEnergy.photonFlux, dtype: float32
Pandas is a very useful data analysis library. More information is available under https://pandas.pydata.org.
ph_flux.plot(figsize=(4,3))
<matplotlib.axes._subplots.AxesSubplot at 0x2ad29c6cf4e0>
What if you wanted to get more than one device and/or property?
The get_dataframe method combines different sources into one single data object (also pandas):
fluxes_pos = run_dir.get_dataframe(fields=[("*/XGM/DOOCS", "*.i[xy]Pos")])
type(fluxes_pos)
pandas.core.frame.DataFrame
fluxes_pos.head(5)
| SPB_XTD9_XGM/XGM/DOOCS/beamPosition.iyPos | SPB_XTD9_XGM/XGM/DOOCS/beamPosition.ixPos | SA1_XTD2_XGM/XGM/DOOCS/beamPosition.iyPos | SA1_XTD2_XGM/XGM/DOOCS/beamPosition.ixPos | |
|---|---|---|---|---|
| trainId | ||||
| 198425241 | -3.121433 | 5.512009 | 0.315761 | 1.293711 |
| 198425242 | -3.121433 | 5.512009 | 0.315761 | 1.293711 |
| 198425243 | -3.121433 | 5.512009 | 0.315761 | 1.293711 |
| 198425244 | -3.090523 | 5.528512 | 0.341187 | 1.336566 |
| 198425245 | -3.090523 | 5.528512 | 0.341187 | 1.336566 |
Scenario III: Getting data with multiple values per train
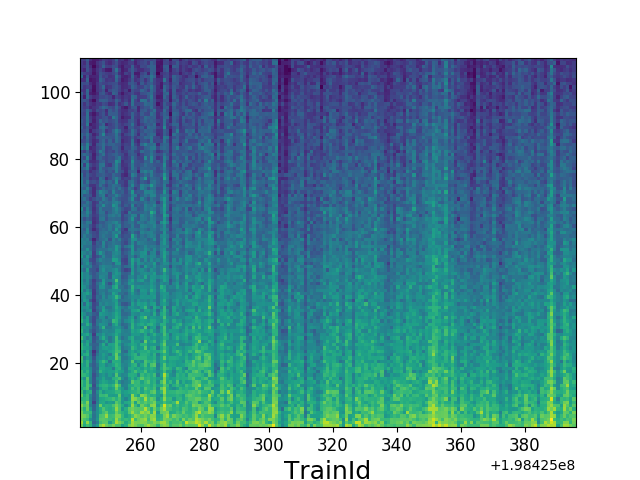
- How can this 2D data be extracted and plotted?
the get_array method returns a data array that contains more than one value per train.
X-ray gas intensity data is pulse resolved and serves as an example:
xgm_intensity = run_dir.get_array('SA1_XTD2_XGM/XGM/DOOCS:output', 'data.intensityTD')
xgm_intensity
<xarray.DataArray (trainId: 156, dim_0: 1000)>
array([[ 957.0532 , 1026.0005 ,  949.8755 , ...,    0.     ,    0.     ,
           0.     ],
       [ 763.8806 ,  794.2738 ,  868.2455 , ...,    0.     ,    0.     ,
           0.     ],
       [ 859.37   ,  995.1641 ,  838.5669 , ...,    0.     ,    0.     ,
           0.     ],
       ...,
       [ 945.2731 ,  812.4336 ,  839.45654, ...,    0.     ,    0.     ,
           0.     ],
       [ 903.26855,  940.15125,  953.9436 , ...,    0.     ,    0.     ,
           0.     ],
       [ 944.08386,  949.549  ,  861.7509 , ...,    0.     ,    0.     ,
           0.     ]], dtype=float32)
Coordinates:
  * trainId  (trainId) uint64 198425241 198425242 ... 198425395 198425396
Dimensions without coordinates: dim_0
plt.imshow(xgm_intensity[:,:100].T)
<matplotlib.image.AxesImage at 0x2ad29c988eb8>
a labeled array (xarray) is returned. More information on labeled arrays can be found on http://xarray.pydata.org
How to install/get karabo-data?
Karabo-data is available on GitHub and there are multiple ways to install it:
- it is automatically available when you enter maxwell via jupyther-hub → https://max-jhub.desy.de
- it is installed in maxwell's anaconda environment →
module load anaconda/3 - it can be install using pip →
pip install (--user) karabo_data - the latest version could be downloaded from GitHub →
git clone https://github.com/European-XFEL/karabo_data.git
A much more detailed documentation is available on readthedocs :
